Embarking on a journey to build your own OpenStreetMap (OSM) tile server is not just a technical project—it’s a lesson in patience, problem-solving, and iterative learning. It’s a process that underscores how deeply intertwined software engineering is with perseverance and strategic thinking. When I first started, I had no idea just how many moving parts this task involved. But, as with many ambitious IT projects, the real value came not just in achieving the final result, but in navigating the challenges and evolving with each setback.
In this post, I’ll take you through my experience—the highs, the lows, and the invaluable lessons learned—as I attempted to set up a custom OSM server, create vector-based maps, and serve them efficiently over the web. This is part one of a two-part series. Here, I’ll focus on the learning journey, the tools I experimented with, and the myriad ways things went wrong before I found a path forward.
If you’ve ever worked in software development or IT infrastructure, you’ll recognize the familiar pattern: attempt, fail, reflect, iterate, and—eventually—succeed. By the end of this post, you’ll see how this iterative approach helped me conquer the complexities of OSM and set the stage for a reliable solution, which I’ll detail in part two.
What is OpenStreetMap (OSM), and Why Is Setting Up a Server So Challenging?
For those unfamiliar, OpenStreetMap (OSM) is an open-source, community-driven project that offers free and detailed geographic data. It’s a global map created and maintained by thousands of contributors. Many know it as an alternative to Google Maps or Apple Maps (or even Bing Maps if anybody still uses it), but it’s much more than that. What makes OSM so appealing for developers is the sheer flexibility and control it offers. You can extract raw data for almost any geographic feature, from roads and rivers to points of interest. This makes OSM an incredibly valuable resource for developers who want to build custom mapping applications without relying on third-party services like Google Maps or Mapbox (a commercial OpenStreetMap provider).
However, the flexibility of OSM data also makes it challenging to work with. The raw data must be transformed to suit different use cases. For example:
- Nominatim: If you’re doing geocoding (converting addresses into coordinates), you’ll need a specialized setup.
- Vector-based maps: Modern web maps often rely on vector data for smoother rendering and flexibility. This requires a very different data structure than what you’d use for static images (PNG tiles).
In this series, I focused on creating vector-based maps, which are more efficient than pre-rendered image tiles. The goal was to generate a file in the .mbtiles format—an efficient container for storing map tiles that can then be served to clients using a tile server. Serving vector tiles eliminates the need for pre-rendered PNG images and allows maps to be styled dynamically, improving performance and flexibility.
The challenge? Transforming OSM’s raw, sprawling dataset into something useful takes a lot of computing power, strategic thinking, and problem-solving. And that’s where the real adventure begins.

The Learning Curve: Familiarizing Myself with OSM and Tile Servers
The journey started with learning the basics of OpenStreetMap and the infrastructure required to serve OSM data. I was already familiar with PostgreSQL and its geospatial extension, PostGIS—essential tools for storing and querying geographic data. However, OSM data comes with its own unique challenges.
OSM data is designed to be highly flexible, and each use case requires a different subset of data. For instance, generating tiles for a map requires geometry data—roads, buildings, parks—while a search engine like Nominatim needs address data and place names. Each of these data sets must be transformed and optimized based on the tool you’re using. This was my first big lesson: Understanding the use case determines the tool and data structure.
While researching tile servers and OSM tooling, I encountered a common theme: there’s no one-size-fits-all solution. The more I dove into it, the more I realized that serving OSM data efficiently requires an intricate web of tools and workflows.
But also regarding the tiles themselves. There are many guides out there showing outdated ways. One of my many attempts ended in generating pre-rendered PNG tiles which I didn't want. Working with vector based tiles still is quite new and so you need to research even more thoroughly.
Try #1: Running a Tile Server in a Virtual Machine
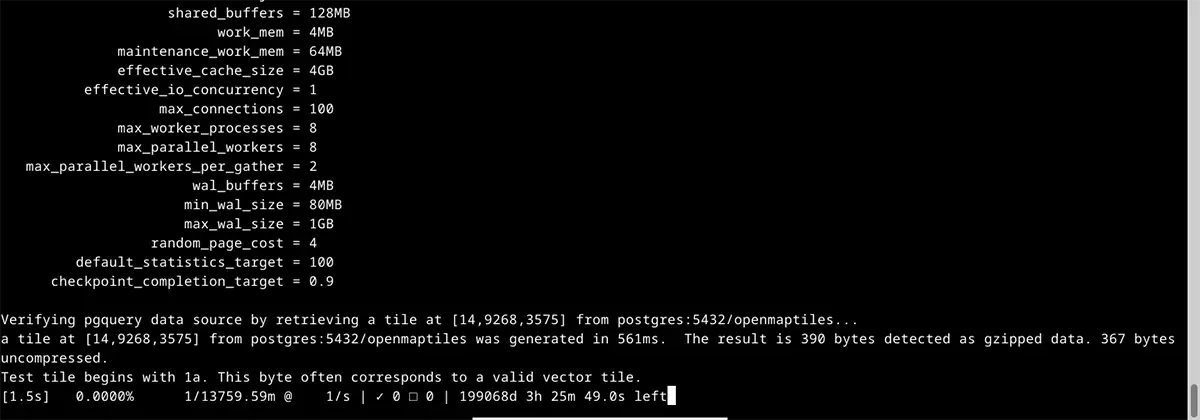
My first attempt was ambitious but modest in scope: I wanted to start by rendering maps for Switzerland, a small extract of the OSM dataset (about 400MB). My initial environment was a virtual machine (VM) running on a quad-core PC, where I installed osm2pgsql—a tool that imports OSM data into PostgreSQL with the PostGIS extension.
What followed was a humbling experience in resource management. The first problem I hit was that osm2pgsql is a resource hog. It quickly became clear that my VM simply couldn’t handle the memory and CPU demands of importing OSM data. The process dragged on for hours, with the custom SQL scripts taking over 12 hours to execute. Even worse, database structure checks took another 10 hours. The whole process felt painfully slow, and the results were underwhelming. The VM’s limited resources meant I couldn’t properly test the tile serving process because it was struggling just to keep up with data import. This also explains the very long time remaining as you can see in the screenshot above.
Key Lesson: OSM data processing is resource-intensive. Starting small helps, but a serious hardware setup is essential even for basic tasks.
At this point, I knew I had to upgrade my environment to make any real progress.
Try #2: Moving to a Local Linux Machine
For the second attempt, I moved the project to my local Linux machine—a more powerful system with more storage and processing power. This time, I was optimistic. The data import process went smoother, and I managed to get the OSM data into a PostgreSQL database relatively quickly.
I decided to test the tile serving capabilities using Martin, a lightweight tile server API that works with vector tiles. Everything seemed to be going well until I tried to render the maps in a sample web app using MapLibre GL.
Initially, the map looked beautiful, but something seemed off. After some investigation, I discovered that the sample style.json file provided by MapLibre was still fetching map data from a public OSM server, not from my local Martin API. So, the pretty map I was seeing wasn’t my doing at all!
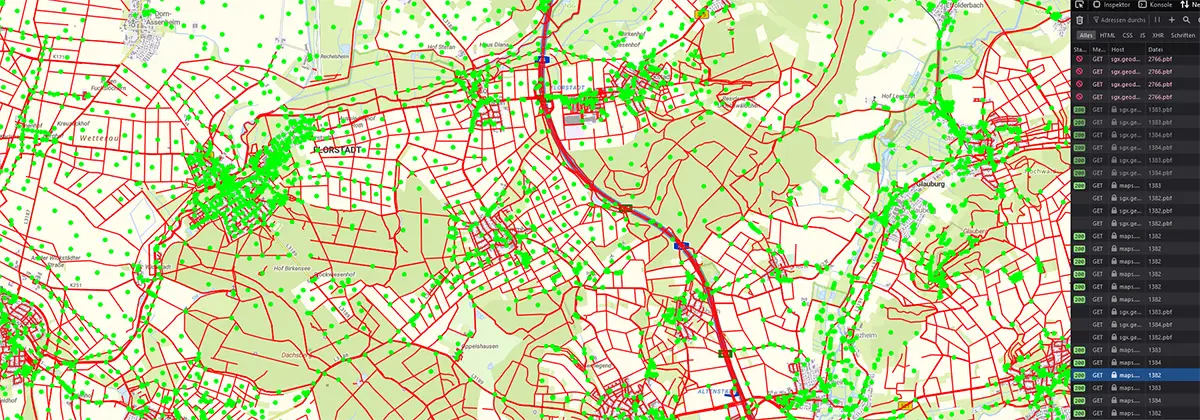
I corrected the style.json to point to my local API, but then I ran into a new problem: the map turned into a mess of strange, weirdly colored polygons. Roads, buildings, and features were vaguely visible but rendered incorrectly. Zooming in revealed streets as solid blocks with none of the expected detail. But it showed a recognizable pattern which looked a bit like a real map, so at least we were working with correct data.
Key Lesson: Debugging in complex systems requires peeling back layers to uncover where things break. In this case, the data structure wasn’t suited for my tile server, leading to improper rendering.
At this point, I realized the issue wasn’t necessarily Martin itself—it was likely the data and zoom levels. But after several frustrating attempts to tweak the setup, I decided to explore other tools.
While Martin seems to work fine nowadays I chose tileserver-gl. It provides a "light" version which is a standalone server you can simply install via npm. It works fast, reliably, provides everything I need and just needs the .mbtiles file. But more about my final setup in part 2.

Try #3: Generating mbtiles on an old Computer
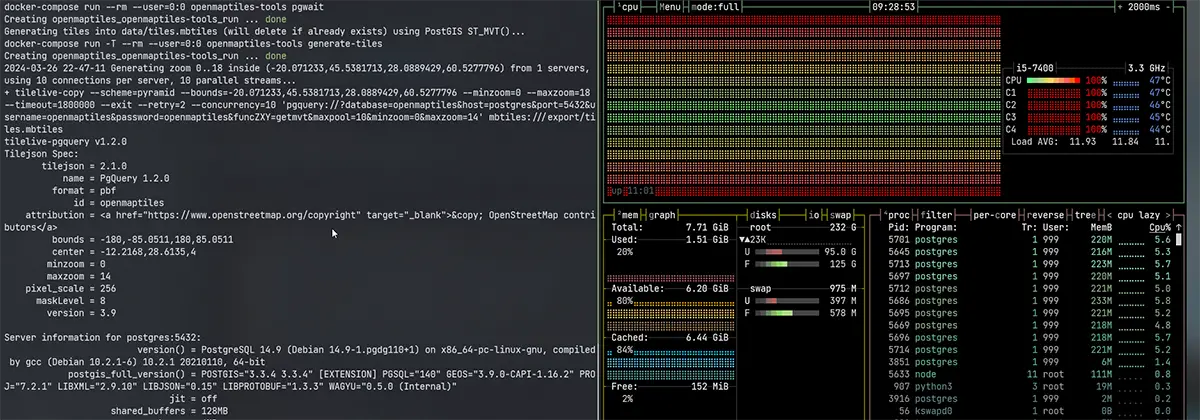
Determined not to give up, I decided to pull out an old PC I had lying around. It was an AMD FX-6100 machine with six cores, 24GB of RAM, and a decent 500GB HDD—old, but still powerful enough for this experiment. I set it up with Debian 12 and turned to OpenMapTiles, an open-source toolchain designed to simplify the process of creating vector tiles in .mbtiles format.
I’m usually not a fan of docker environments, especially since they tend to pollute production hosts and need a whole ecosystem for realiable management. But for such a temporary host just for generating the file it was fine. That’s also pretty handy with this approach—in the end you simply have one file you can easily put on a web host and serve.
This is where things started to click. OpenMapTiles provided a more robust workflow for generating vector tiles. I ran their quickstart.sh script and successfully generated a small .mbtiles file for Switzerland within a few hours. The victory, however, was short-lived. Upon closer inspection, I realized I had set the maximum zoom level too low, meaning the map lacked critical detail—no street names, no points of interest, just basic outlines of shapes.
Still, I had a working setup, and I knew I was getting closer.
I scaled the project up to include the DACH region (Germany, Austria, Switzerland) and let the process run for over 28 hours to generate the tiles. But then disaster struck. After spending days rendering tiles, I found out that some zoom levels were completely missing—different parts of the map simply didn’t exist at certain scales. A deep dive into the logs revealed SQL timeouts during the generation process. The hardware simply couldn’t keep up. All those warnings on different OpenStreetMap platforms and guides all stating that you need powerful hardware and a lot of time were right.
Key Lesson: Hardware bottlenecks can manifest in subtle ways. The system seemed to work, but the sheer volume of data was causing SQL processes to time out, leading to missing map sections.
Try #4: The Breakthrough with Better Hardware
By this point, I had refined my understanding of the process, but I needed more power. So, I turned to my HTPC—a media PC with an Intel i5-7400, 16GB of RAM, and a fast NVMe SSD. The SSD was critical because disk speed plays a huge role in processing large datasets like OSM.
This time, the process was significantly faster. I was able to import the DACH data in a couple of hours, run the necessary SQL scripts, and generate the .mbtiles file in just over 22 hours. Finally, everything worked as expected! The map was fully functional, zoomed smoothly, and loaded quickly.
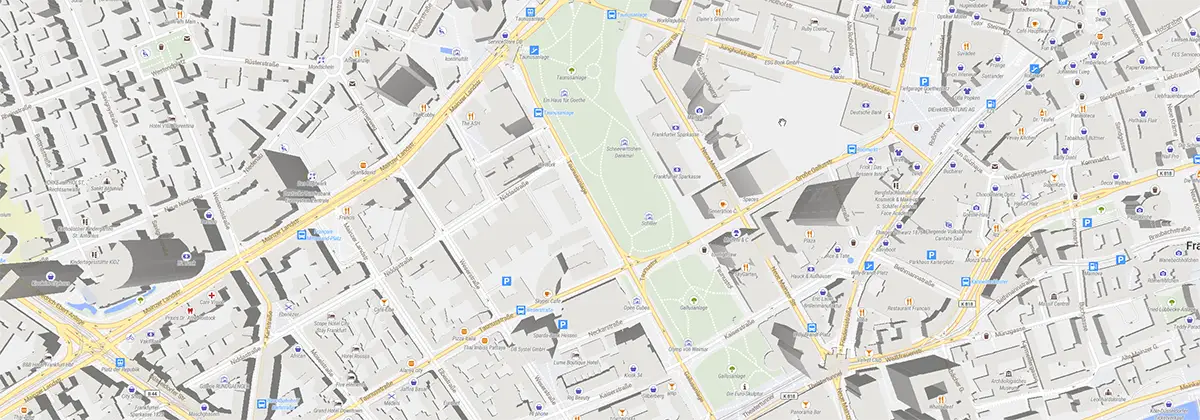
The sense of satisfaction after weeks of trial and error was immense. I now had a 4GB .mbtiles file that I could serve reliably. The combination of powerful hardware, fine-tuned processes, and a deeper understanding of OSM data had finally paid off and I was able to explore a detailed map of the DACH area, including POIs and even 3D models of all buildings. Incredible!
Key Lesson: Success in IT is often a product of persistence and continuous iteration. Each failure taught me something valuable about the tools, the process, and the infrastructure needed.
Final Thoughts
Building a custom OpenStreetMap server was a journey that tested my patience and problem-solving skills. What started as a seemingly simple project became a long, evolving side task that stretched over months—especially when rendering took days, and I had to start over with each new problem.
One major turning point was the role AI, particularly GPT-4, played in troubleshooting. GPT helped me identify key issues quickly, pointing me toward the right tools and resources when I was stuck. While it wasn’t a magic bullet, it significantly cut down the time I would have spent digging through documentation or guessing at solutions.
That said, the real foundation of this project was the open-source community. The incredible tools and guides from OpenMapTiles, PostGIS, and others made this technically challenging process possible for someone working independently. Once you figure things out, it’s amazing how accessible and powerful these tools are.
In the end, this project was a lesson in perseverance. The process may have been slow, but with the right tools, AI support, and open-source resources, I was able to build something reliable. And now that I’ve cracked the code, I’m excited to share the full technical breakdown in Part 2, where we’ll dive into generating vector tiles for Europe and setting up the final map server.
Stay tuned for Part 2, where we’ll dive into the specifics of creating a large-scale map server for Europe. And if you have any questions or feedback on this process, I’d love to hear from you in the comments below!
This post was created with the assistance of artificial intelligence (GPT-4o). The illustrations are AI-generated. All screenshots were taken by me. Curious about how AI can create such texts and illustrations from your own ideas? Learn more about it on the Neoground GmbH website.


One comment
Add a comment
18 Feb 2025, 14:45
AnonymVielen Dank