In Part 1 of this blog series, I shared the long and winding journey of creating a custom map server using OpenStreetMap (OSM) data. We walked through the various hurdles, setbacks, and eventual breakthroughs, focusing on setting up a tile server for the DACH region (Germany, Austria, and Switzerland). If you haven’t read Part 1, it’s worth a look to understand the foundational struggles and lessons learned.
Now, we move on to Part 2: the practical, detailed guide for creating a custom map server for the entire European region. In this post, I’ll cover everything from setting up the necessary hardware to generating tiles and hosting your map data via a web server.
If you’re ready to tackle large-scale OSM data and deploy your own tile server, this is where the rubber meets the road!
Recap: Trials and Errors So Far
As a quick refresher, in Part 1 we faced several challenges trying to build and serve OSM maps. After experimenting with different tools and environments—ranging from VMs with insufficient resources to old hardware that couldn’t handle the load—we finally succeeded by leveraging OpenMapTiles. We managed to render the DACH region (Germany, Austria, Switzerland) after tweaking our hardware and setup, but the process wasn’t without its hurdles. From slow imports to running out of space and running into memory issues, it was a lesson in persistence and troubleshooting.
Having overcome those challenges, we’re now equipped with a solid process and the experience needed to scale this setup for a much larger region—Europe.

The Hardware: Powering Your Tile Server for Europe
Rendering map data for an entire continent like Europe (about 30GB of compressed OSM data) is no small task. The hardware requirements increase significantly compared to the DACH region (about 4GB of compressed OSM data). Here's what you’ll need:
Minimum Hardware Requirements
- CPU: A modern quad-core processor or better (e.g., Intel i5, AMD Ryzen 5)
- RAM: 24GB to 32GB (more is always better)
- Storage: At least 500GB SSD (NVMe preferred for speed, but SATA SSD works too), I used a 750GB SSD
- Alternatively, you can use a second SSD for Docker storage. This prevents disk space errors when handling large files and you can keep your small system SSD or run the system completely via USB or so.
While you can set this up on a cloud instance for temporary use, be aware that processing Europe’s data will take days, if not weeks. A powerful local machine or rented cloud instance is recommended for this phase.
But you need this host only for building the .mbtiles file. Once this is done, you can simply serve it from any casual webserver. The serving is quite lightweight and works well on my normal web hosts.
Disk Configuration for Docker
If you’re using an additional SSD, make sure Docker uses the second drive for storage. This can be configured by creating /etc/docker/daemon.json:
{
  "data-root": "/path/to/externaldrive/docker-files"
}
This will prevent the main SSD from running out of space, especially when dealing with large datasets like Europe, which can require over 500GB of storage when everything is uncompressed.

Setting Up the Host Environment
Installing the Basics
We’re using Debian 12 for this setup. I simply installed a minimal version of it just with SSH support. Start by installing the necessary tools:
apt update
apt install docker-compose vim git curl build-essential htop tmux
Because this is a long-running process, I recommend using tmux, a terminal multiplexer, so you can keep sessions running even if your SSH connection drops. Here’s how to start a session:
tmux new -s osmLearn the basics of navigating tmux—this will save you from having to restart long processes due to SSH connection issues. You can detach from it via "Ctrl + B, then pressing D" and reattach again via tmux a -t osm. Some might prefer GNU Screen instead.
Cloning OpenMapTiles
Once your environment is ready, let’s clone the OpenMapTiles repository and initialize the necessary directories, just like the official openmaptiles guide suggests:
cd /usr/local/src
git clone https://github.com/openmaptiles/openmaptiles.git
cd openmaptiles
make
Configuring Zoom Levels
For higher detail in the generated map, I recommend setting the maximum zoom level to 20 in the .env file. You can easily change it with the following command:
sed -i 's/^MAX_ZOOM=.*/MAX_ZOOM=20/' .env
source .env
The source command then makes the variables accessible in our environment. Note that you need to source the env file every time you create a new environment (e.g. after reboots).

Step-by-Step Guide: Generating Tiles for Europe
Now we dive into the detailed process of creating the map tiles for Europe.
Instead of relying on the quickstart script provided by openmaptiles, we run the commands step by step. This gives us more flexibility, especially if problems arise.
Initial Setup
Before we start generating tiles, clean up the environment and prepare Docker:
make refresh-docker-images
make init-dirs
make clean
make all
This ensures everything is set up correctly and old data or incomplete runs don’t interfere.
Downloading the Europe Dataset
Next, download the .osm.pbf file for Europe. You can either download it manually from Geofabrik or let OpenMapTiles handle it for you:
make download area=europeIn either case the europe.osm.pbf file is put in the data dir. If you tinker around just like I did, it might make sense to save the file and copy it in the data dir every time you setup everything again.
This file is over 30GB, so make sure you have enough disk space.
Starting the Database
For preloaded data, start the database using OpenMapTiles’ pre-populated settings:
make start-db-preloadedThis will launch a PostgreSQL / PostGIS database to handle the OSM data.
Importing the OSM Data
Now, we begin importing the raw OSM data into the database. This step takes a long time, on my host typically around 10 hours:
make import-osmImporting Wikidata Labels
Next, import labels from Wikidata for additional context (e.g. points of interest). This is faster, taking around 2-3 hours:
make import-wikidataBut note that all this data needs quite a lot of space. I was working with a 500GB SSD and this process failed after some hours. So I setup an old 750GB SSD, configured it for docker and ran all commands again. This time it succeeded.
Running SQL Scripts
This step involves running a series of SQL scripts to format and optimize the data. This took me over 13 hours, but it’s a crucial part of the process:
make import-sqlAt this point, you’ve done most of the heavy lifting. Check if the database structure is correct and valid:
make analyze-db
make test-perf-null
Since we're generating the tiles data for a section of the planet we need to calculate the bounding box of it:
make generate-bbox-file ${MIN_ZOOM:+MIN_ZOOM="${MIN_ZOOM}"} ${MAX_ZOOM:+MAX_ZOOM="${MAX_ZOOM}"}Generating the Tiles
With the data prepped, it's time to generate the tiles. This is by far the longest step, especially for a region as large as Europe. In my case, it took over 13 days to complete!
make generate-tiles-pgKeep in mind that the process will show an exaggerated estimated time at first. As the rendering progresses, this number will start to drop significantly.
After running for 2 hours it says that only 6279 days and 23 hours are left until the generation is completed.
One day went by and we're down to 3537 days left, 0.0264% done.
After 3 days we're down to only 2255 days, 0.1131% done. After 4 1/2 days only 1890d are left, 0.2142% done.
After 6 days, 6 hours and 6 minutes we have 6666.66m done which corresponds to 0.4080%, now only 1490 days are left.
After 9 days we have over 1.2% done, only 705d to go...
Then it starts accelerating. After 11 days we're up to 4.4%, only 222 days remaining.
After 13 days it finally was done and returned:
  Zoom  Tile count    Found tile ranges
------  ------------  -----------------------
     0  1             0,0 x 0,0
     1  2             0,1 x 1,1
     2  4             1,2 x 2,3
     3  16            2,4 x 5,7
     4  56            4,8 x 10,15
     5  168           9,17 x 20,30
     6  644           18,34 x 40,61
     7  2,475         37,69 x 81,123
     8  9,504         75,139 x 162,246
     9  37,664        150,279 x 325,492
    10  150,304       300,559 x 651,985
    11  600,362       601,1118 x 1303,1971
    12  2,396,628     1203,2236 x 2606,3942
    13  9,586,512     2406,4472 x 5213,7885
    14  38,332,392    4813,8944 x 10426,15771
Once the process completes, you’ll have a massive 38GB .mbtiles file, which contains all the map tiles data for Europe. This file can now be served to your users.
Since we're done on this host, we can stop the database:
make stop-db
Setting Up a Tile Server
After generating the tiles, the next step is to serve them on a web server. For this, we’ll use TileServer GL Light, which is a lightweight version of the TileServer tool and has no dependencies.
Installing TileServer GL Light
If you’re comfortable with Docker, you can follow the standard TileServer GL guide, provide it your mbtiles file and you're ready to go. In my case, I opted for a Node.js-based setup which keeps my web server more lightweight (and docker-free). Start by installing Node.js and TileServer GL Light:
curl -fsSL https://deb.nodesource.com/setup_22.x -o nodesource_setup.sh
bash nodesource_setup.sh
apt-get install -y nodejs

npm install -g tileserver-gl-light
Web Server (Nginx)
For serving the tiles, I use Nginx. Install it as follows:
apt install nginx-fullCreate a directory to host your map files:
mkdir /var/www/mapsCopy your generated europe.mbtiles file into this directory.
Now, run the tile server:
/usr/bin/tileserver-gl-light --file /var/www/maps/europe.mbtiles -p 3000 -u "https://maps.example.org/tiles"This serves the tiles on port 3000. The tiles can now be accessed via 127.0.0.1:3000/tiles but all returned URLs will have https://maps.example.org/tiles as their root.
Configuring Nginx
To serve your maps over the web, we need to configure Nginx. In my case I want to provide the maps via the https://maps.example.org URL via SSL (I'm using lets encrypt for this). Create a new server block (vhost) in /etc/nginx/sites-enabled/maps.conf:
server {
    listen 80;
    listen [::]:80;

    server_name maps.example.org www.maps.example.org;
    return 301 https://$host$request_uri;
}

server {
    listen 443 ssl;
    listen [::]:443 ssl;

    server_name maps.example.org www.maps.example.org;
    ssl_certificate /etc/letsencrypt/live/example.org/fullchain.pem;
    ssl_certificate_key /etc/letsencrypt/live/example.org/privkey.pem;

    # Provide the tiles via tileserver on port 3000
    location ~ /tiles/(?.*) {
        proxy_set_header  X-Rewrite-URL $uri;
        proxy_set_header  X-Forwarded-Host $host:$server_port;
        proxy_set_header  X-Forwarded-Proto $scheme;
        proxy_redirect    off;

        proxy_pass        http://127.0.0.1:3000/$fwd_path$is_args$args;
    }

    location / {
        root      /var/www/maps;
        rewrite ^(.+)/+$ $1 permanent;
        try_files $uri $uri/ /index.html;
    }
}
Reload Nginx:
systemctl reload nginxNow, your maps are accessible at https://maps.example.org and your tiles server at https://maps.example.org/tiles which will proxy everything to 127.0.0.1:3000. We now have a functioning tiles server, we just need a small maps UI to display this.
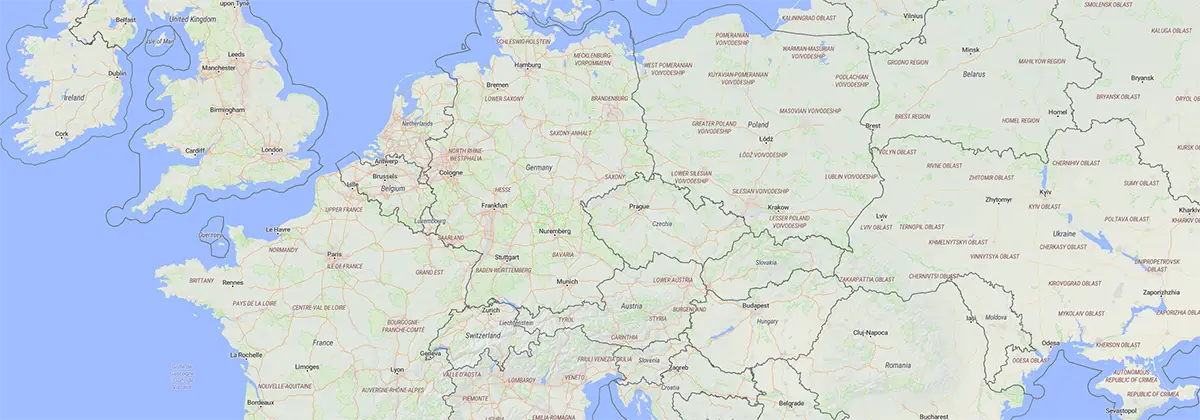
Displaying Your Map: MapLibre GL JS
To visualize the tiles, we’ll use MapLibre GL JS, an open-source mapping library. Create a simple index.html file in /var/www/maps based on the MapLibre example like this:
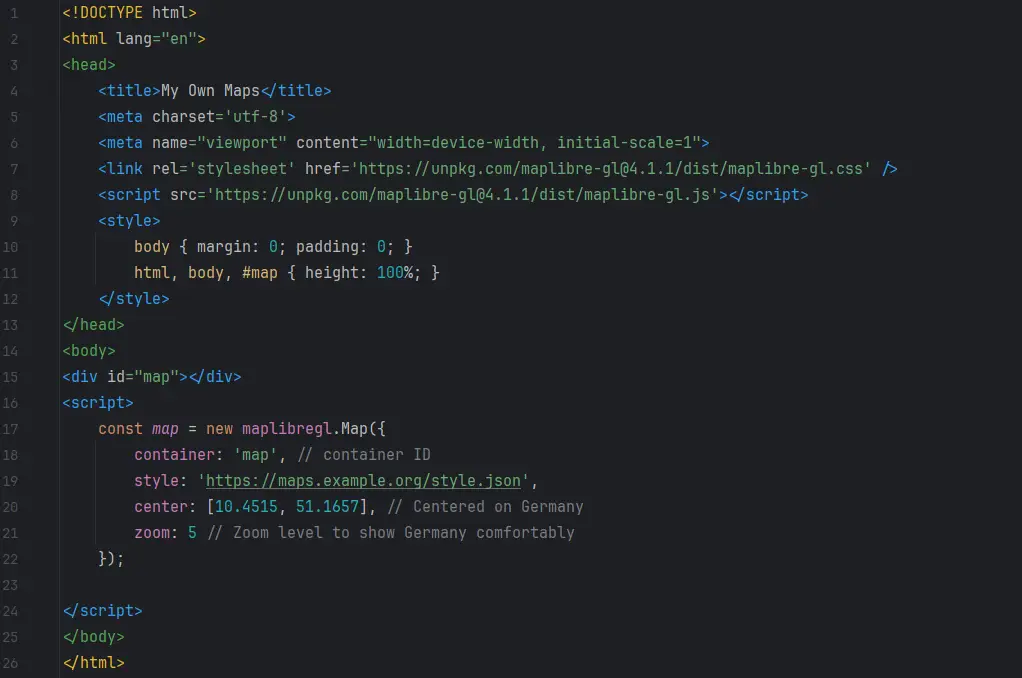
In the same directory we now have to provide a style.json which contains all of our configuration. You can choose from different map styles, but I went with OSM Liberty which looks very good.
So I take the style.json from it and adjust the openmaptiles tiles source in line 12. Instead of using maptiler we want to use our own tiles server:
{
    "sources": {
        "openmaptiles": {
            "type": "vector",
            "url": "https://maps.example.org/tiles/data/v3.json"
        }
    }
}
Automating with Systemd
We ran our tile server manually. But for production use it makes sense to run it as a service, so it's also automatically started on each boot.
To ensure your tile server runs as a service, create a systemd service file at /etc/systemd/system/tileserver.service:
[Unit]
Description=Tileserver GL osm tile server
After=local-fs.target
After=network.target
After=nginx.service

[Service]
PIDFile=%t/tileserver.pid
ExecStart=/usr/bin/tileserver-gl-light --file /var/www/maps/europe.mbtiles -p 3000 -u "https://maps.example.org/tiles"
ExecReload=/bin/kill -USR2 $MAINPID
User=www-data
Type=simple

[Install]
WantedBy=multi-user.target
Enable and start the service:
systemctl enable --now tileserver.serviceNow your maps server is ready, fully setup and will autostart on every boot.
Conclusion
After weeks of hard work, patience, and problem-solving, you’ve now set up a custom map server that can handle the entire European region. From downloading and processing the OSM data to configuring the web server and serving tiles via MapLibre GL JS, you now have full control over your own OpenStreetMap-based solution.
While it took 13 days to generate the European map tiles, and countless weeks of tinkering around to find the right way (this project started in February and the tiles for Europe were finally done way after Easter at the end of April), the results were more than worth it. This system can now scale to handle larger regions, and with the tools in place, you can continue building and improving upon this infrastructure.
We now have our own maps we can provide in our apps and don't have to worry about API quota or data privacy.
Got questions or feedback? Feel free to share in the comments below!
This post was created with the assistance of artificial intelligence (GPT-4o). The illustrations are AI-generated. All screenshots were taken by me. Curious about how AI can create such texts and illustrations from your own ideas? Learn more about it on the Neoground GmbH website.


2 comments
Add a comment
17 Jun 2025, 13:52
Robert KostenHi Sven,
Thx for the write-up :-) I've been considering setting up something similar for a ttrpg campaign, with only a fictional city map instead of any real osm data. Do you know if any of the map editing tools work with your setup? I'd prefer using them, obviously, instead of cobbling things together manually ;-)
Regards,
Robert
22 Nov 2024, 11:17
vinchallo Sven
habe deine Seite gelesen weil ich selber gerne ein Homepage hätte mit Karten!
wie du sehen kannst https://kocher.reisen/index.php/schweiz/457 gehe ich viel und gerne wandern.
Davon gibt es auch immer eine gpx datei.
Statt die ganze Karten am Anfang runterzuladen - könnte man diese nicht on the fly machen - das heisst dann wenn ein gpx file diese benötigt werden diese runtergeladen?
Kann man die installation nicht ohne Docker machen sondern einen eigenen virtuellen Server verwenden und dem virtuellen Server eine externe SSD anbinden?
gruss
vinc